
3 Steps to End Your Nonprofit's Fiscal Year the Right Way
June 30 marks the end of the fiscal year for nonprofits, which provides a great time to review what your organization has accomplished during last 12 months. Of course, that’s much easier when you’ve tracked your work and collected information throughout the year, but now is the perfect time to do that if you haven’t already.
1. Collect data for year-end reporting
To get the most insights into your nonprofit’s success over the past 12 months, you’ll need records and data. Whether you start simply with your donor data (names, donation amounts, and any other identifiers they provide) or you have extensive reports from your CRM, gather all the data about your donors into one file for easy reference.
But instead of trying to parse through your year-end data by staring at a spreadsheet all day, you can visualize your data for easy interpretation and reporting.
2. Upload data for visualization
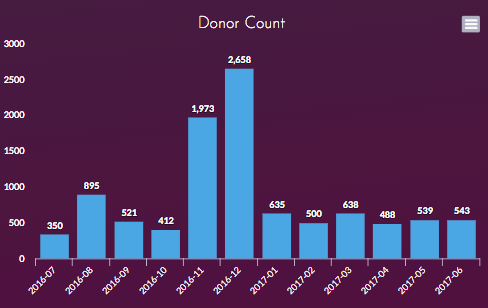
Causemo Insights makes it really easy to see what your year-end data really says; all you need to do is upload your most recent giving files. Once you’ve got that taken care of, you’ll get automatic access to graphs and charts, like:
Donor count
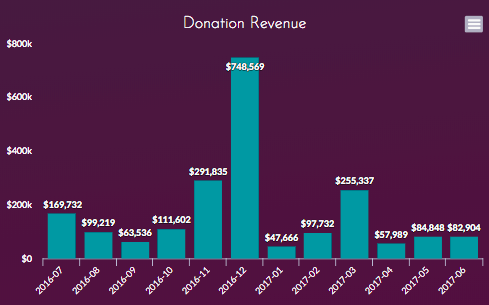
Revenue
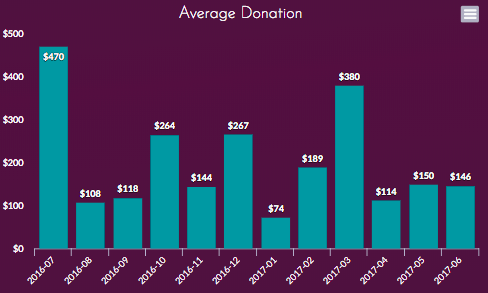
Average donation
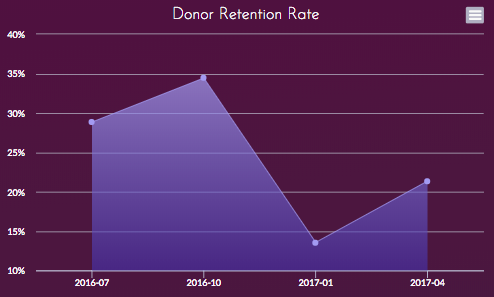
Donor retention
Causemo Insights also visualizes:
- Donor age, education, gender, location, and income
- Growth rate
- Giving channel (if provided)
The best part is that each of these data visualizations can be exported into infographics, reports, and communications that are vital for year-end reporting.
3. Use your Insights dashboard to plan for the next year
The good thing about visualizing your data is that you very clearly notice trends.
- What is your data telling you?
- Which months were best for your organization?
- Which months were the worst?
- Are you noticing any trends in your donor demographics (i.e. age or giving channel?)
All of these trends, easily seen by the spikes and valleys in your charts and graphs, indicate something powerful that can help you make next year even better than this one. Consider which campaigns launched during the largest donation months, and which campaigns ended or flopped during the low points. Also pay attention to your donors and how they’re giving, so you can target communication to different donor segments.
Your giving trends and benchmarking data can also advise budgets for marketing, ensuring that money is being spent in the areas that work for you, rather than budgeting for what may work in your sector.
Data-backed decisions
Year-end reporting and planning for the new fiscal year can feel a little bit like fumbling in the dark. But when you use your previous year’s data to create visuals that clearly illustrate what worked and what didn’t, you’ll benefit from easier decision-making and improved results the next year.
Have you signed up for a free account with Causemo yet?


