
Now that you’ve created your Causemo Insights account and uploaded your donor and giving files, you can immediately view information about your organization’s performance and how you stack up against other nonprofits in your sector.
This, all by itself, is highly valuable information. Not only can you gain insights into the giving trends and demographics of your donors, but you can also use this data to guide your strategy and targeting for future fundraising efforts when launching Facebook ads, planning events and and more. Rather than scouring multiple databases or Excel files for this information, we’ve created a way to get the full picture - all in one place.
In our Get Started Guide, we show you how to upload your data, including the Excel spreadsheet format you’ll need for easy upload to the platform. Once you’ve got the right file format and have uploaded your data, you’re ready to rock!
Your data visualizations
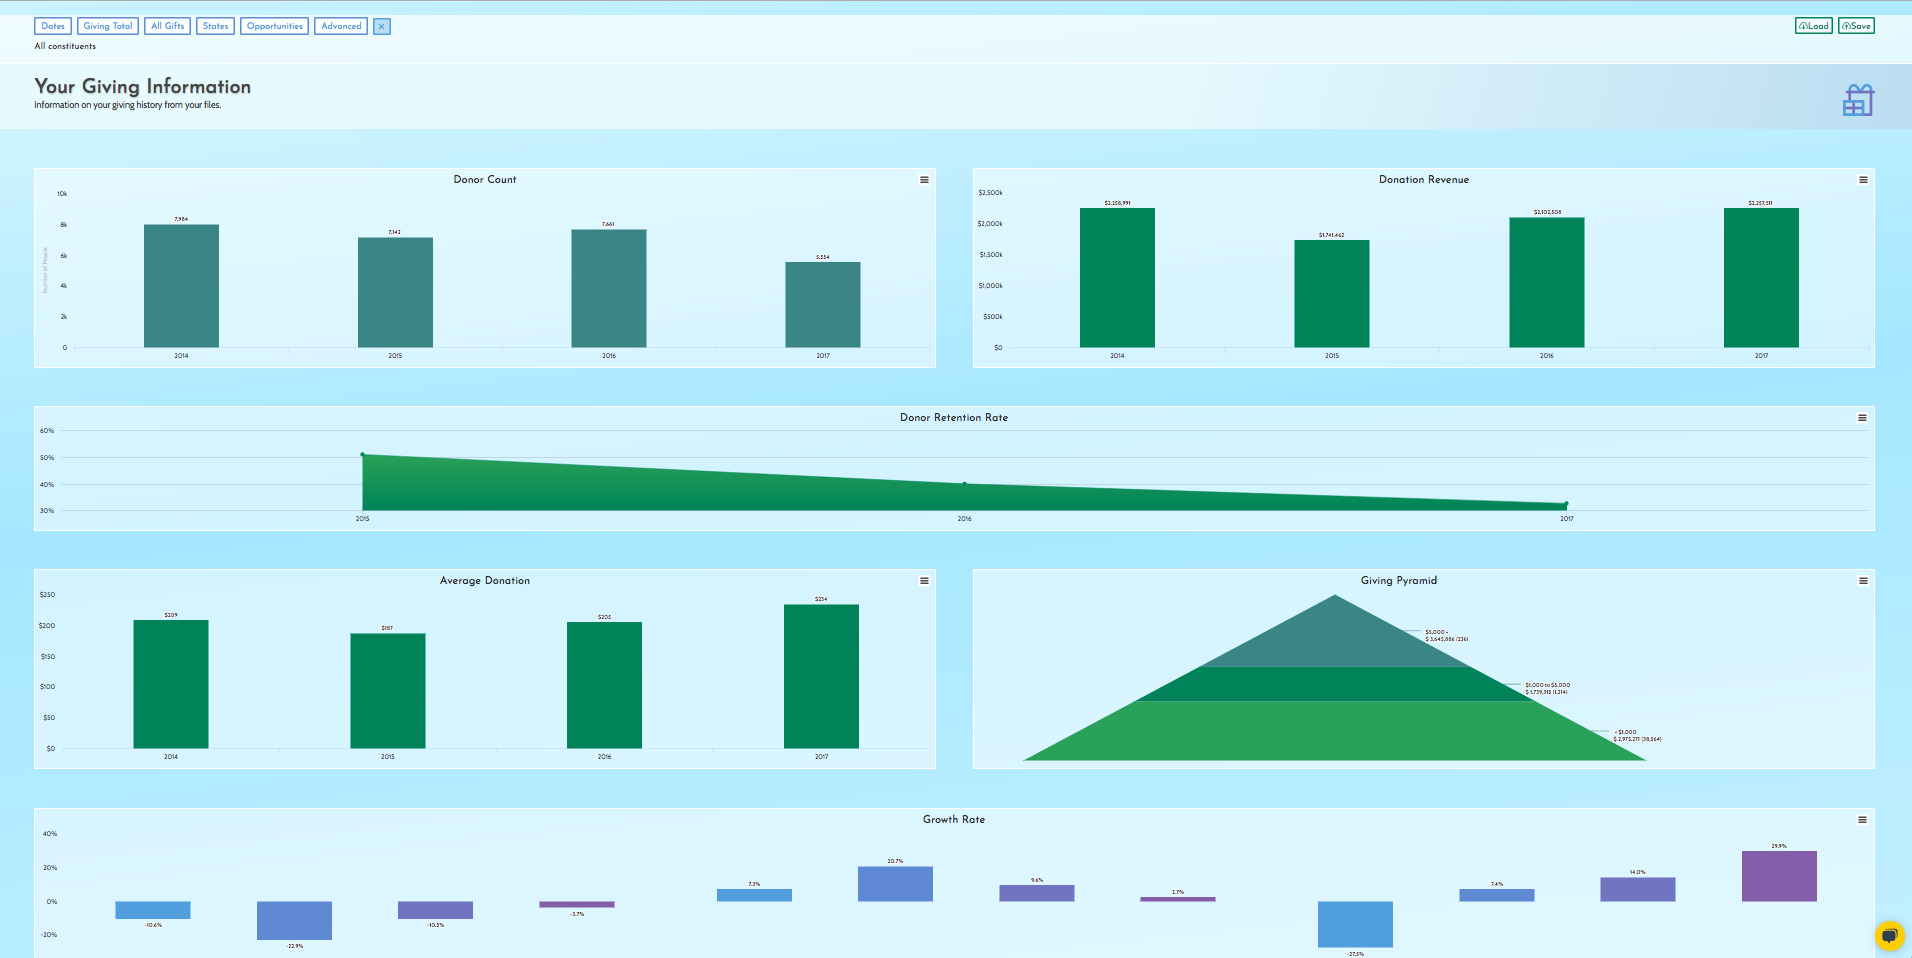
Much like the Nonprofit Sector Data you see when you first sign into Causemo Insights, we take your organization’s Donor File and split it into unique views: Constituent Age, Gender, Household Income and Education Level.From your Giving File, we also create visualizations of your Donor Count, Revenue, Average and Retention Rate.
What happens next?
It’s great to see all of your data visually represented - it’s a thousand times better than reading a spreadsheet! But when it comes to planning future fundraising campaigns, communications with your donors and supporters or annual planning, how can Causemo Insights help?
Nonprofits using Insights have found that all three sets of data - Sector, Constituent and Giving - each offer deep insights and planning value. Here are just a few examples:
Sector comparisons to guide campaigns
Take a look at your Sector Data (at the bottom of the Constituent Dashboard). Once your own Constituent Data has been uploaded, that area of Causemo Insights automatically populates with a comparison view of the sector as a whole versus your organization.
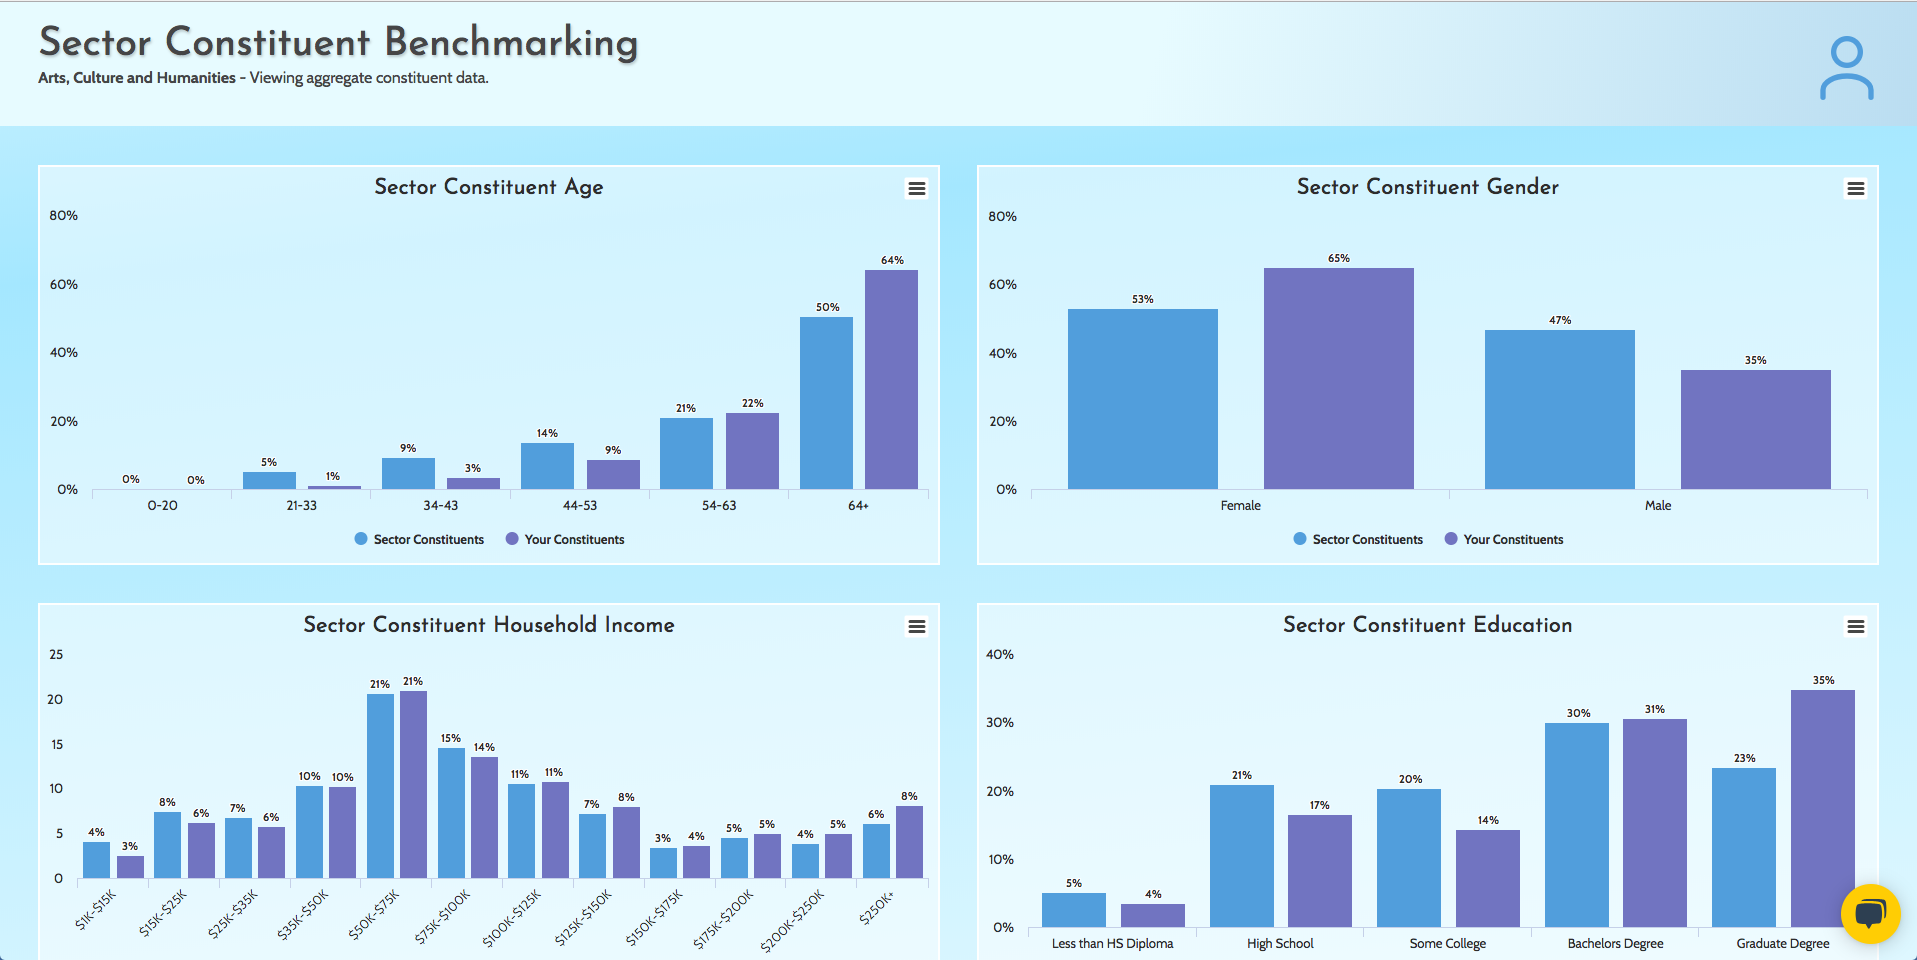
Ask yourself:
- Are there any huge disparities between the two?
- Are there any demographic points that are highly similar?
If there are major differences between the sector and your constituents, you’ll have instant insight into what to focus on to improve. If you don’t see much difference, it means that your current donors are interacting with your organization the same way they do with others in your sector. Take these insights and use them to inform your strategy and planning for future campaigns.
If you haven't already, sign up for a free Causemo Insights account.
Read on for even more ways data can help increase donations.


